Setting up a dataset
This section goes over how to set up a dataset for training.
CryoViT supports the following file formats for tomogram data:
.mrc,.mrcs
.tiff,.tif
.h5,.hdf,.hdf5
These can be either in uint8 or float32 format.
Caution
CryoViT expects tomogram data to be stored as a 3D array
with shape (D, H, W), with values either between 0 and 255 (for uint8) or
between 0.0 and 1.0 (for float32).
If your tomogram data is stored in a different shape, you will need to reformat it before using CryoViT. Different data ranges will still work, but may lead to suboptimal results if using a pre-trained model.
Tip
You can double-check supported file formats by looking at
the RECOGNIZED_FILE_EXTS variable in cryovit.utils.
Dataset Structure
Datasets consist of a training set and an optional validation set. If provided, the validation set will be used to evaluate model performance.
Each set should have its own data files and corresponding label files.
CryoViT expects either a directory containing multiple tomogram files,
or a single .txt file listing the paths to each tomogram file.
Example Datasets
An example dataset using folders may look like this:
dataset/
├── train_data/
│   ├── tomogram1.mrc
│   ├── tomogram2.mrc
│   └── ...
├── train_labels/
│   ├── tomogram1.mrc
│   ├── tomogram2.mrc
│   └── ...
├── val_data/
│   ├── val_tomogram1.mrc
│   ├── val_tomogram2.mrc
│   └── ...
└── val_labels/
    ├── val_tomogram1.mrc
    ├── val_tomogram2.mrc
    └── ...
while an example dataset using .txt files may look like this:
dataset/
├── train_data.txt
├── train_labels.txt
├── val_data.txt
└── val_labels.txt
with the actual files stored elsewhere.
Important
To ensure that the correct labels are used for each tomogram, the filenames of the label files must exactly match the filenames of the corresponding data files (or correspond to the same order when sorted).
Alternatively, you can provide .txt files listing the paths
to each tomogram file and label file, with one path per line.
Then, the order will follow the order of the lines in the text files.
Label Formats
CryoViT only supports training models for one label at a time, but the label files can contain multiple classes (and thus be re-used for multiple models).
Labels can be defined in two ways:
Binary masks: each voxel is either 0 (background) or 1 (foreground).
Instance masks: each voxel is either 0 (background) or a positive integer unique to each label.
CryoViT, when reading label files, will automatically detect which format is being used.
Masked Segmentation
CryoViT uses masked segmentation by support sparse labels, where only labeled tomogram slices are used to guide training. This means that if only a subset of the tomogram is labeled, the model will not treat the unlabeled regions as background.
Typically, labels consist of three main regions, which will need to be created by the user:
Background: slices with only
0labels. These are typically for slices without any clear objects, used as negative examples to help the model distinguish from noise.Foreground: slices with positive labels. These are the objects of interest that the model should learn to segment.
Masked regions: slices with only
-1labels. These are unlabeled regions that should be ignored during training.
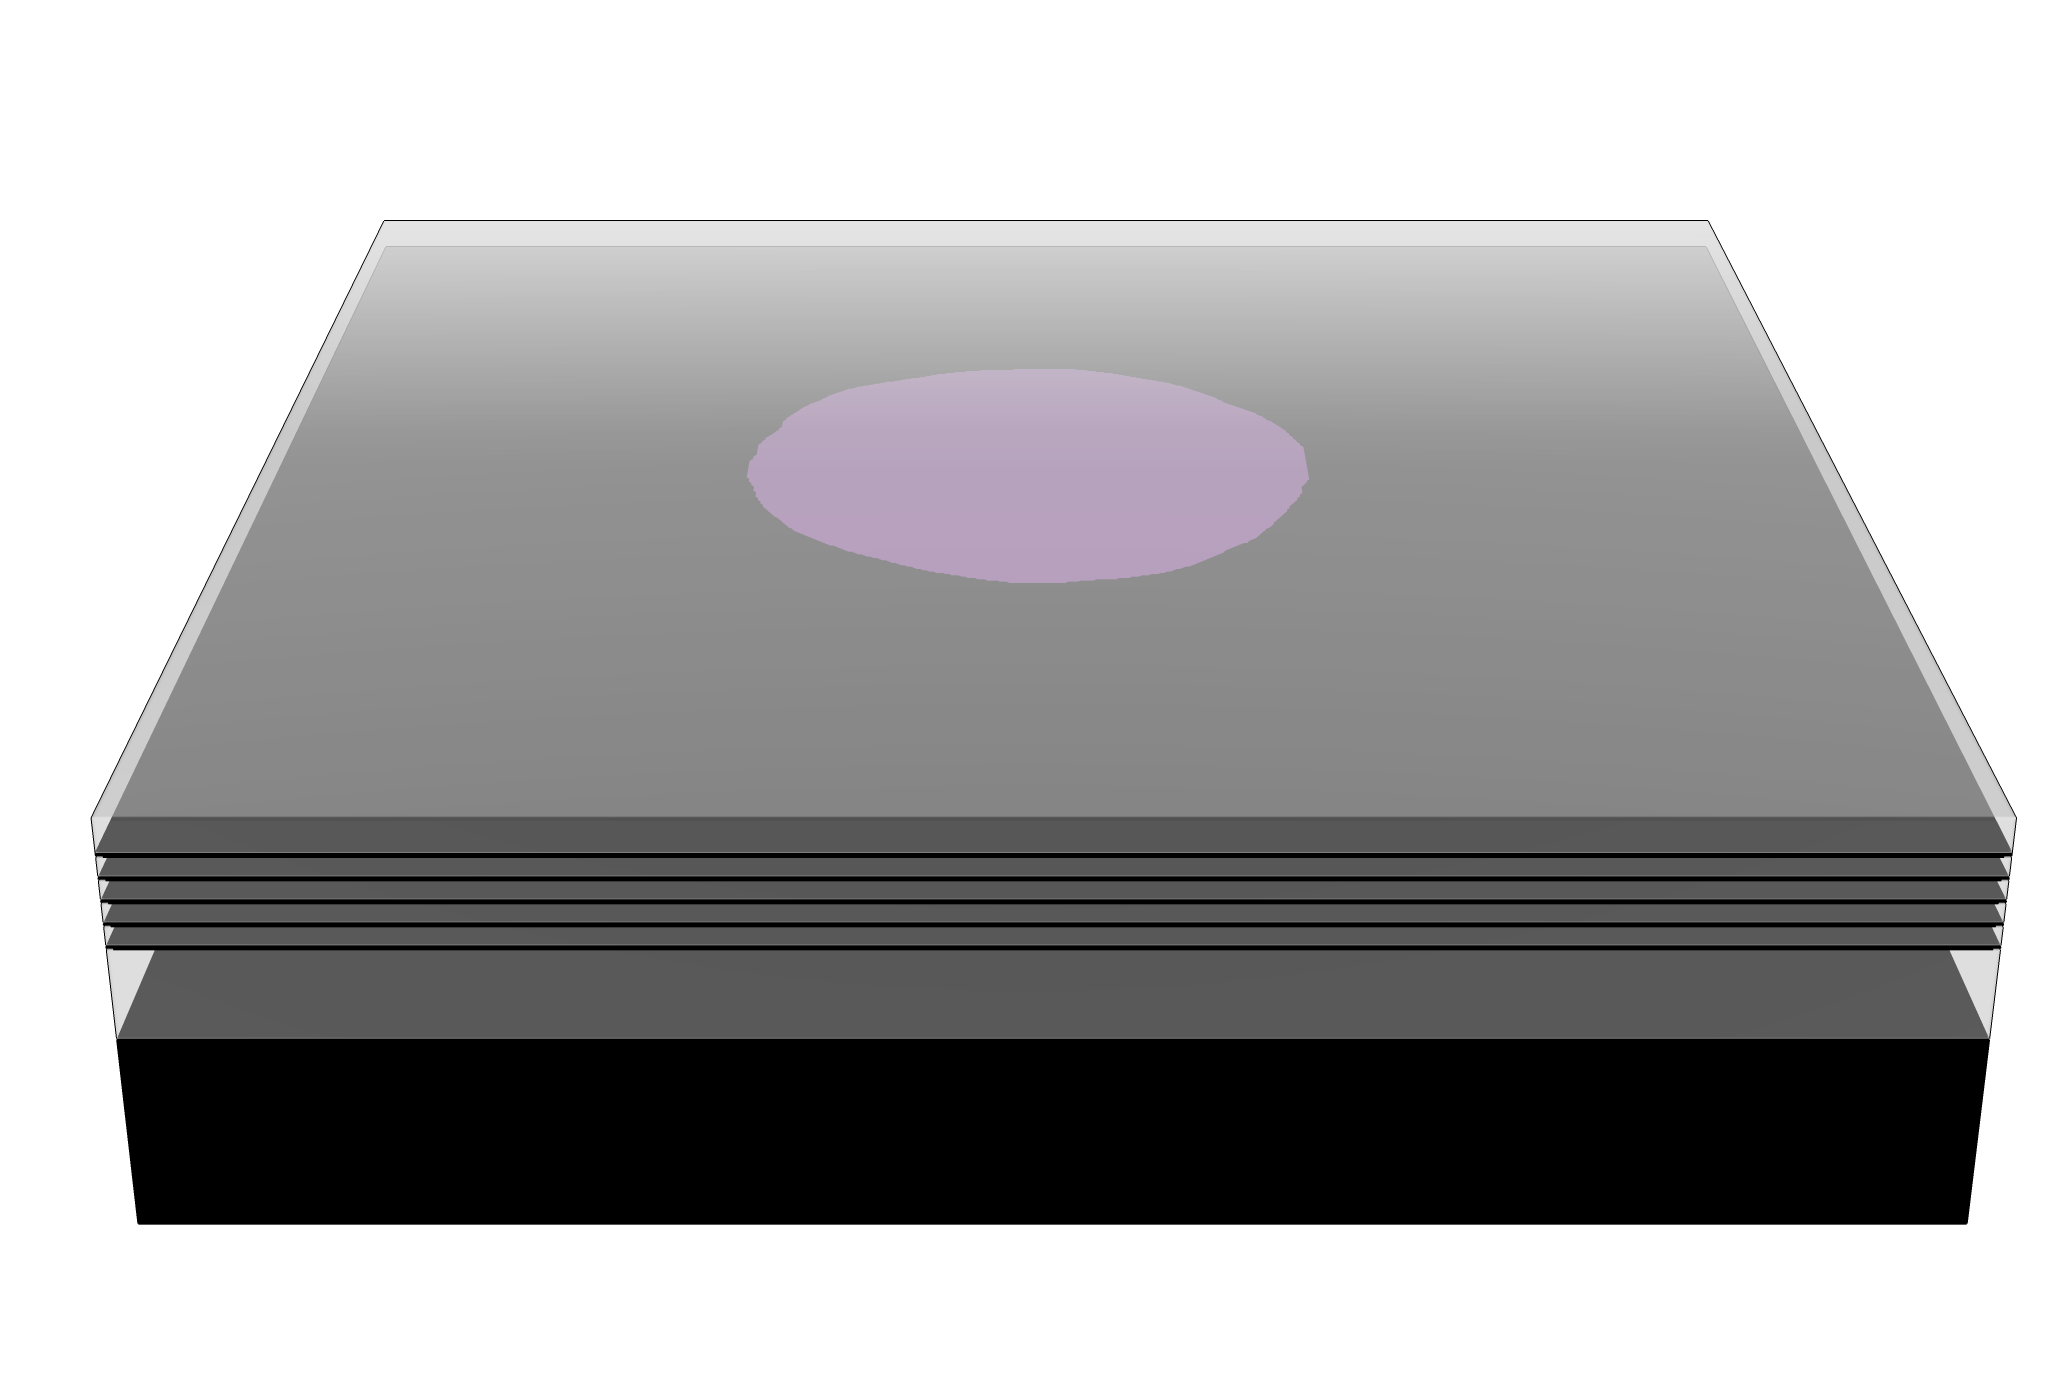
Example of background, foreground, and masked regions in a mitochondria label file. The background is black, the mitochondria foreground is purple, and the masked regions are transparent in gray.
These masked regions must be defined in the label files beforehand if not using napari to create labels (see below).
Using Napari
If you have napari installed, you can use the napari plugin to create and manage datasets directly within napari.
First, open the Dataset Manager from the “Plugins” menu under “CryoViT”. Below is what your napari window should look like after opening the Dataset Manager:
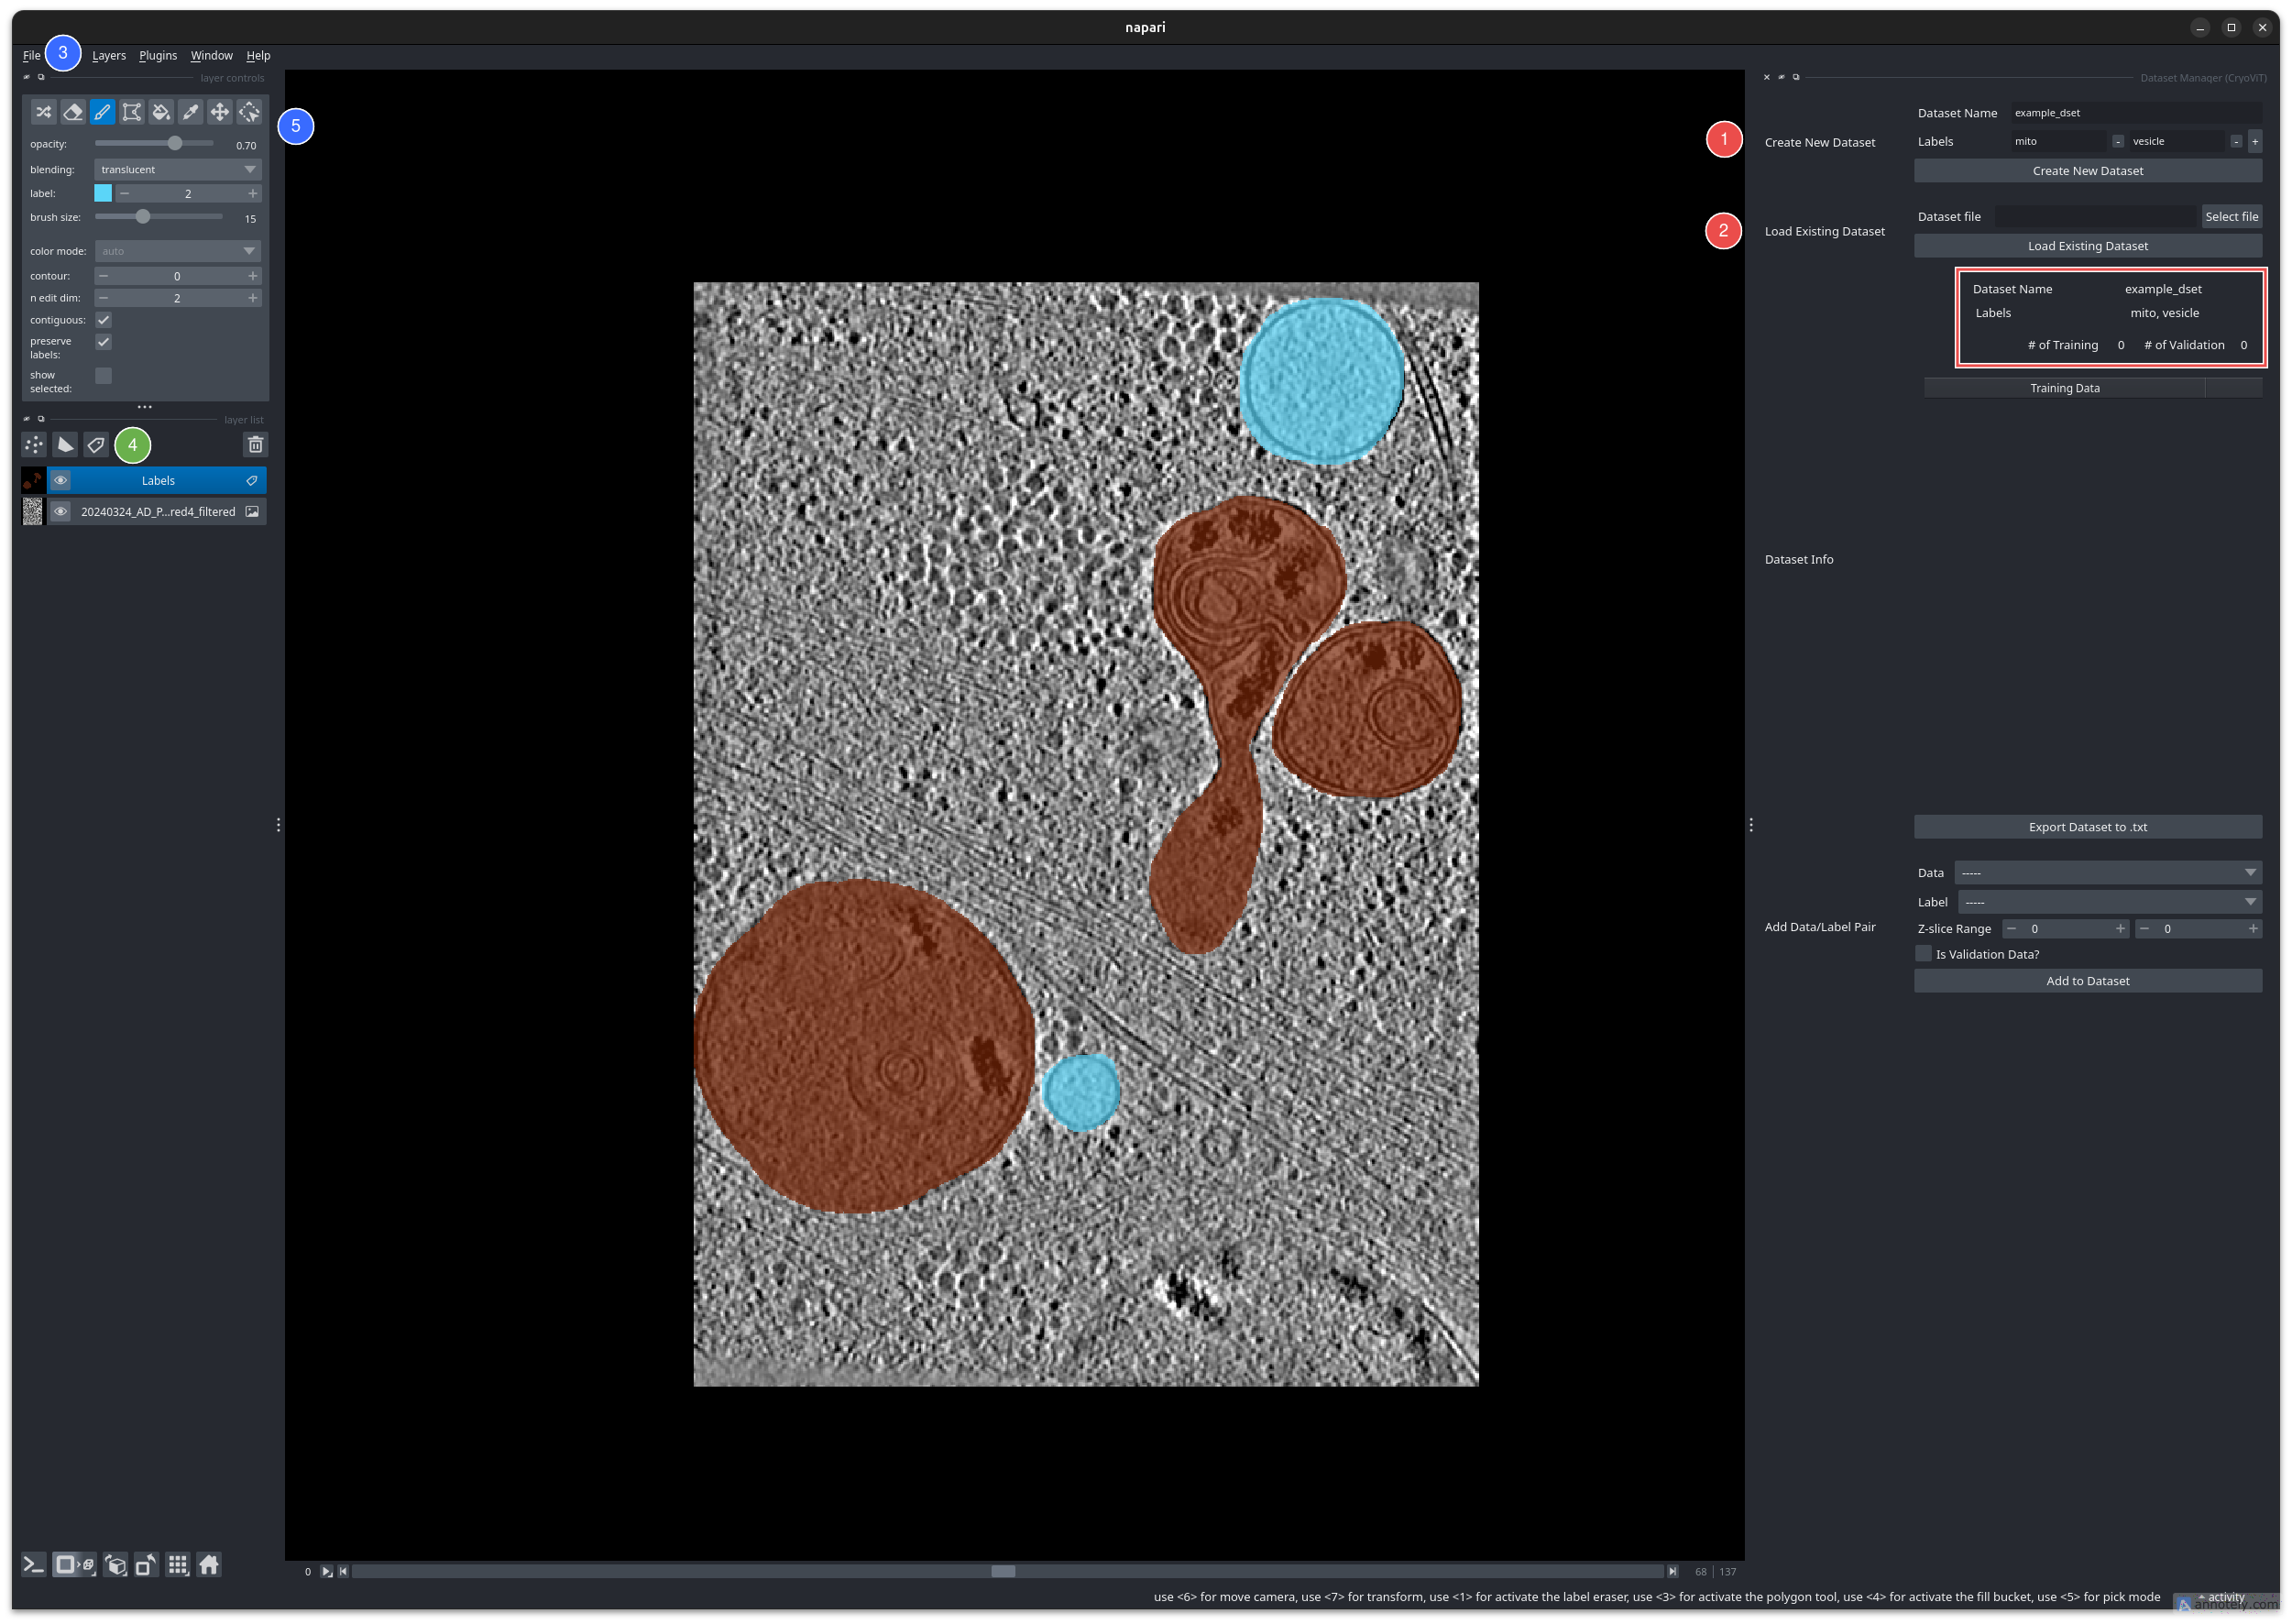
The CryoViT Dataset Manager in napari.
The Dataset Manager contains the following sections for dataset management:
Creating a new dataset: Create a new dataset by specifying a name and an ordered list of labels.
Loading an existing dataset: Load an existing dataset by specifying a
.dsetfile.
Note
The CryoViT plugin uses a custom .dset file format to store dataset
information. This is a binary file that should not be modified manually.
When you have created or loaded a dataset, you can prepare to populate it with tomogram data and labels.
Open a tomogram file using “File” menu (3), selecting the “CryoViT” option when prompted to choose a reader.
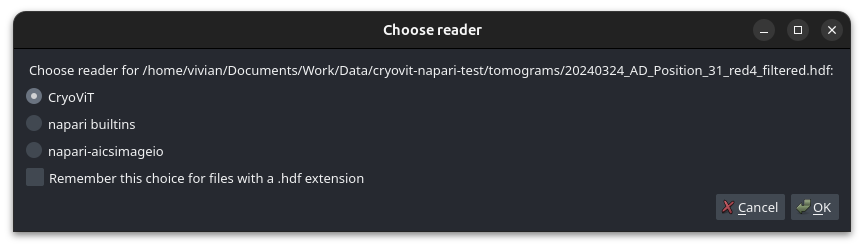
Reader selection window in napari.
Then, add a new label layer using the “Layer” button (4), and add labels using the default annotation tools in napari (5).
Tip
Using a tablet with a stylus can make annotating much quicker and easier.
The recommended setup is to have your dominant hand holding the stylus, while your non-dominant hand uses the keyboard to use common shortcuts.
Extremely helpful shortcuts to remember are:
P or 2: switches to the paintbrush tool.
E or 1: switches to the eraser tool.
[ and ]: decrease/increase brush size.
F or 4: switches to the fill tool.
Using this means you only need to outline a region to fill it in, which is very useful for large contiguous regions.
Z or 6: switches to the move/pan tool.
Ctrl + Scroll Wheel: moves through tomogram slices.
Ctrl + Z/Ctrl + Shift + Z: undo/redo the last action.
When you are done annotating, you are now ready to add the tomogram and your labels to the dataset.
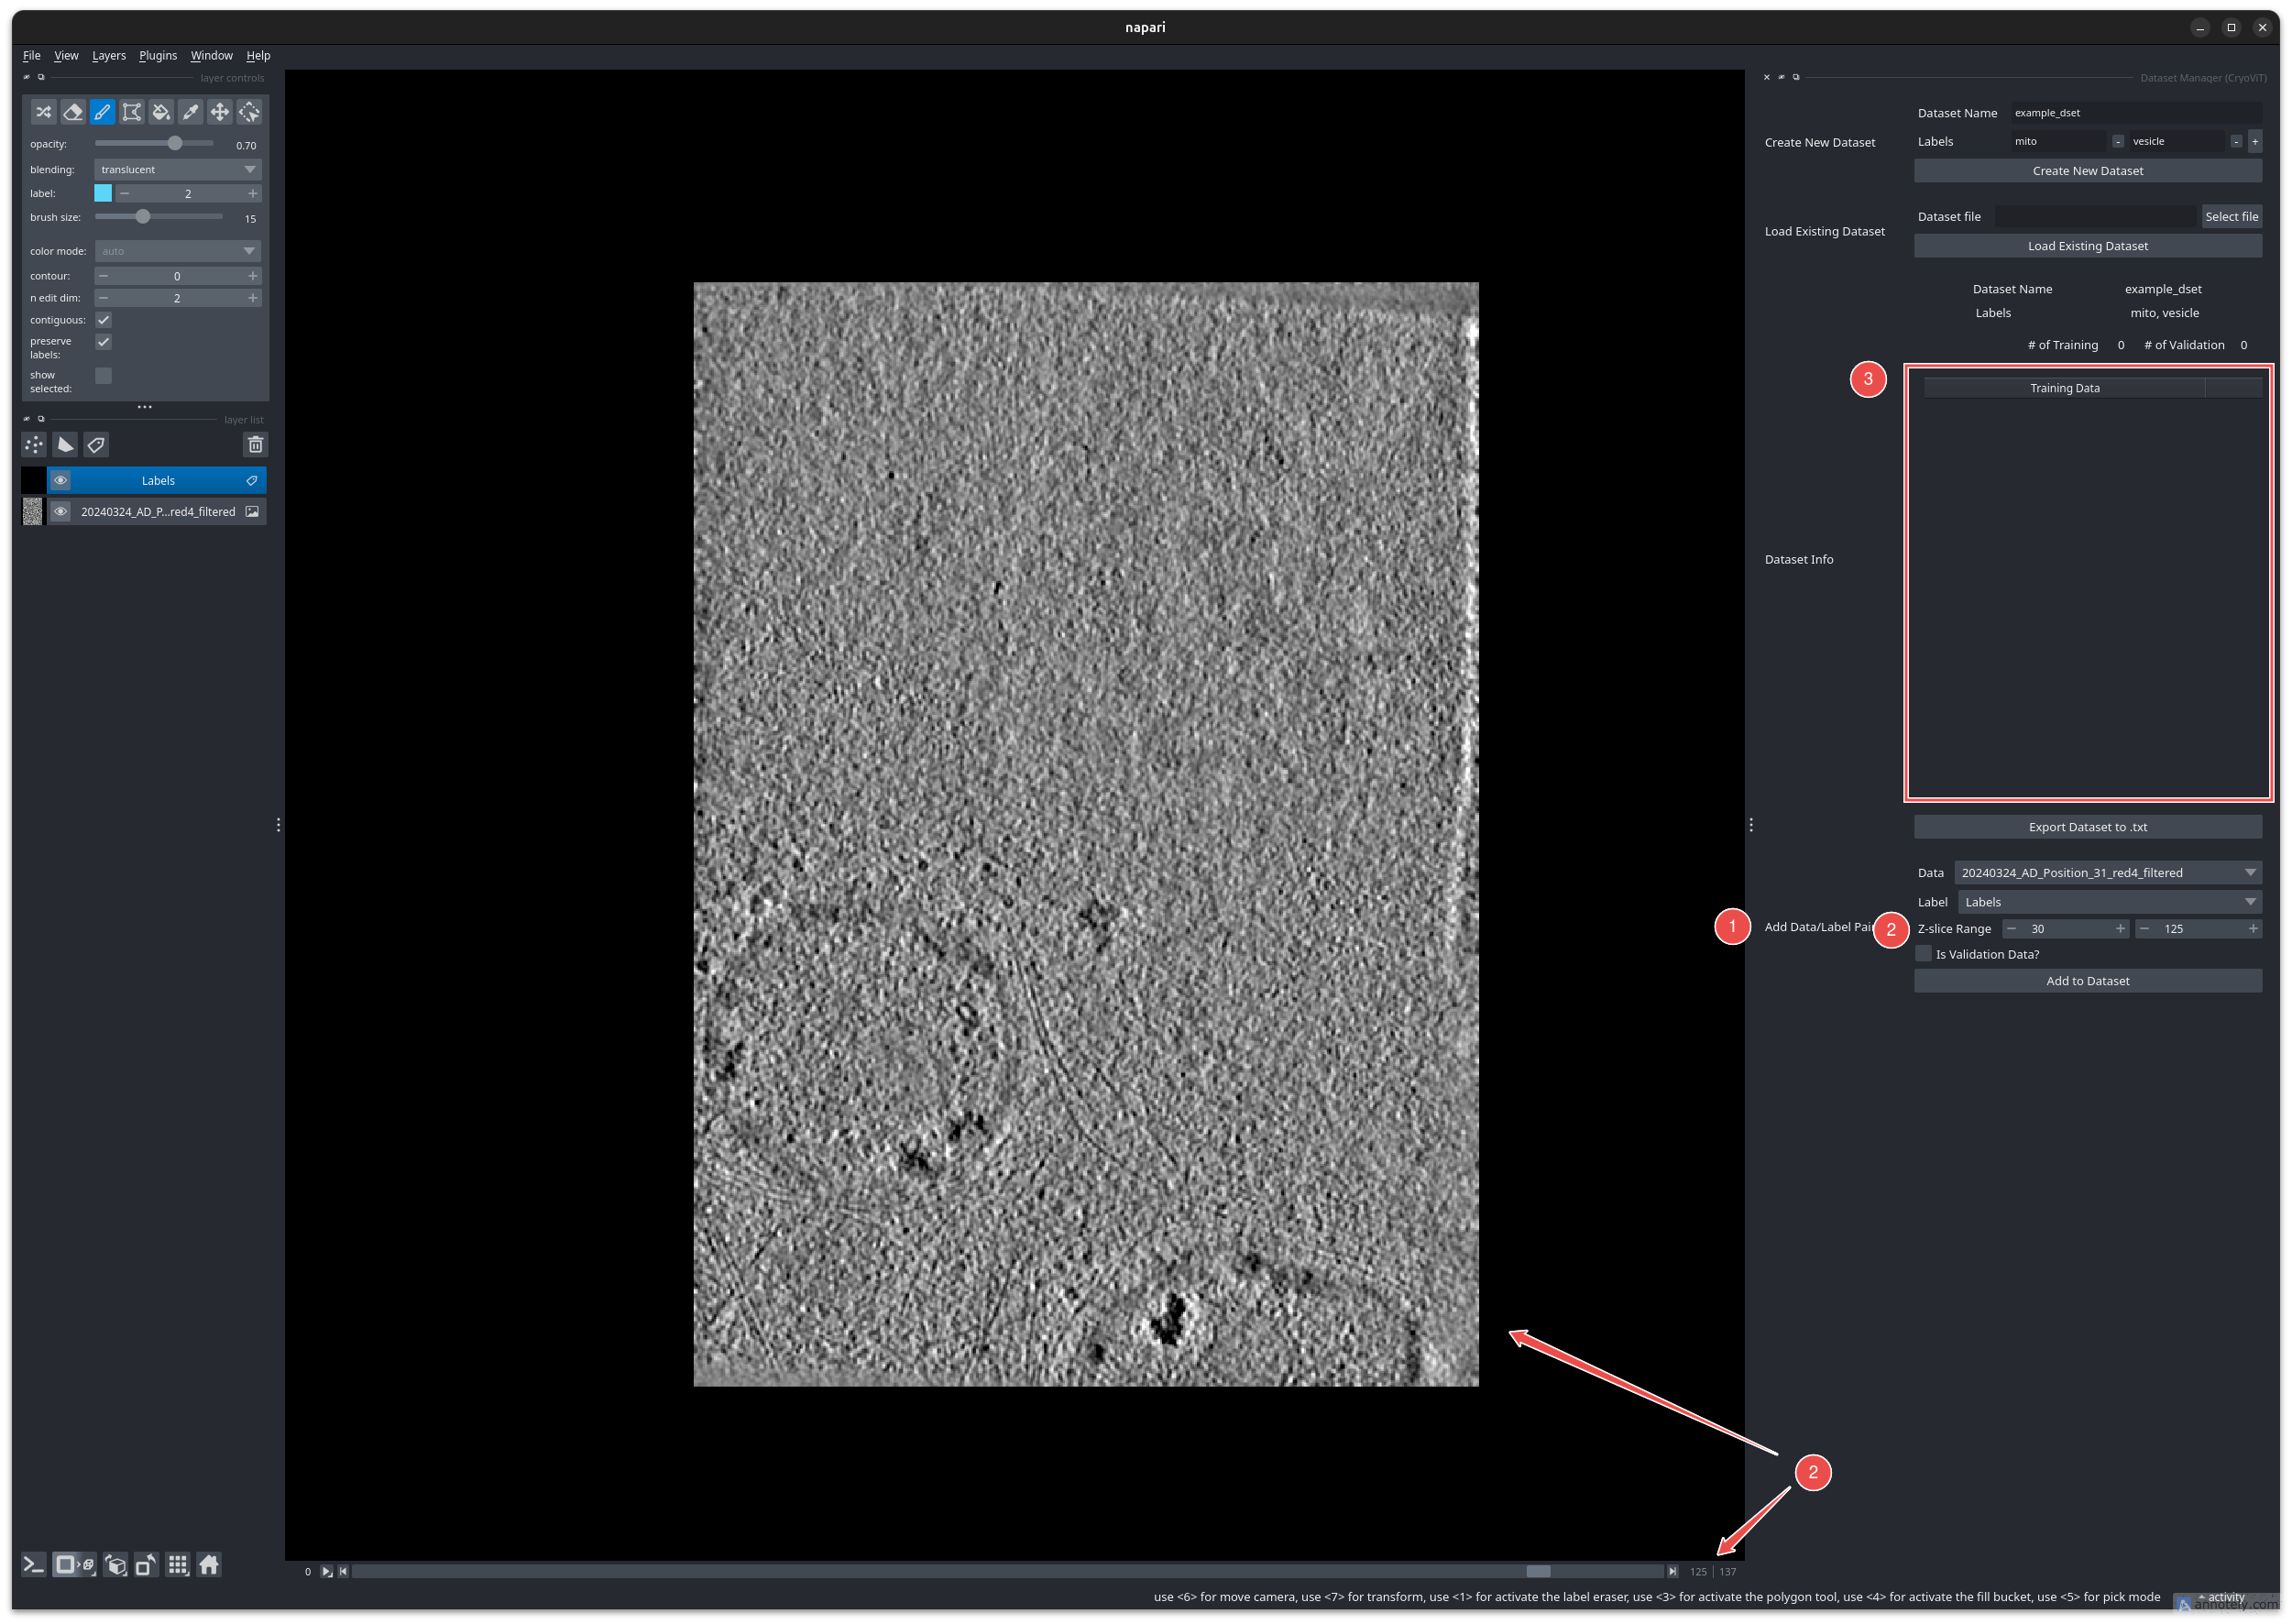
Adding a tomogram and its labels to the dataset.
First, select your data and label layers in the dropdown menus (1).
Then, you can optionally specify the z-limits to use in masked segmentation. These are tomogram slice indices that define the lower and upper bounds of the masked region.
Important
By default, if no z-limits are specified, the entire tomogram will be used as the masked region. However, for the best results, it is recommended to specify the z-limits as the first and last slices where you can clearly see the objects of interest.
For example, the image above shows a slice where the mitochondria are first becoming unclear (due to the inherent limitations of Cryo-ET). You can see that the upper z-limit is set to the slice index of this slice (2).
When you are done, click the “Add to Dataset” button to add the tomogram/label pair to the dataset.
The “Dataset Info” section (3) shows the current contents of the dataset, including its expected labels, and the number of tomograms in the training and validation sets.
You can open the data and labels for any tomogram by double-clicking on an entry, and remove tomograms from the dataset by right-clicking.
Note
Datasets are automatically saved whenever you edit them, so you can safely close napari at any time without losing your progress.
This dataset can now either be used for training directly within napari,
or you can use the “Export Dataset to .txt” button to export the dataset
to a set of .txt files for use with the command line interface.
Now, with a training dataset set up, you can move on to either Running from the command line or Running using Napari to train your model!